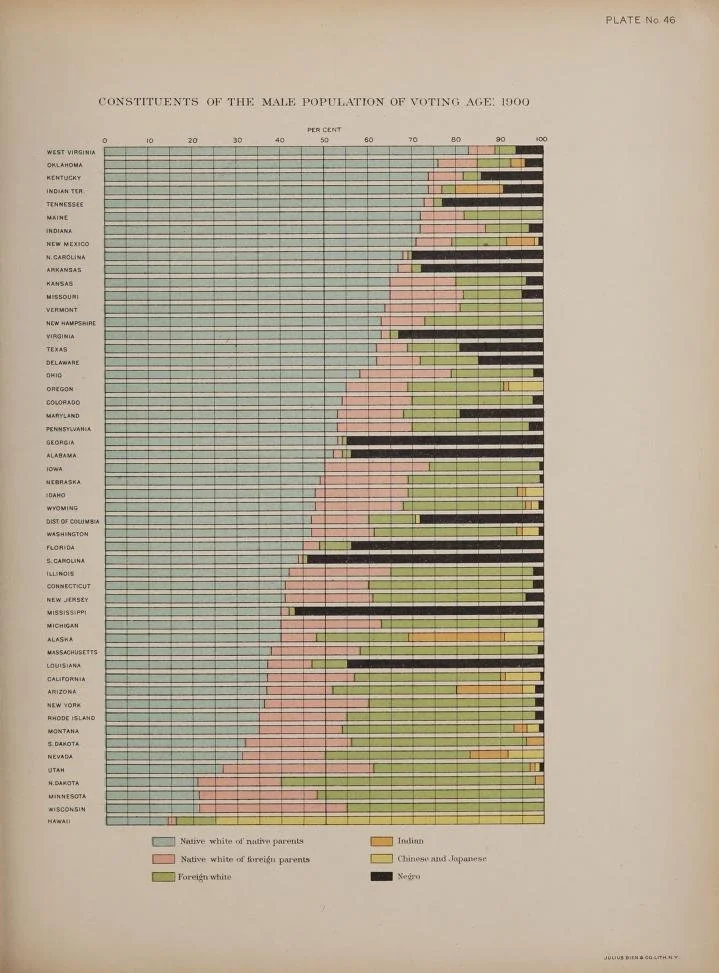
In my research on the Statistical Atlas of the United States from the 1870 to the 1910 Censuses, I investigate how state-sponsored data graphics during this period functioned as instruments of social scientific knowledge production, which inevitably influenced public opinion and policy. Focusing on demographic plates like "Constituents of the Male Population of Voting Age: 1900," my research examines how the U.S. census utilized data visualization forms to map and make sense of the American citizenry in the era of Chinese Exclusion.This plate was incidentally produced by Julius Bien, the German-born lithographer celebrated for his chromolithographic reproductions of Audubon's birds. My research focuses on the aesthetics of this chart and analyzes how a natural history lineage of specimen classification might have informed the racial logics of the Census Atlas. Note that the complexities of minority communities are flattened into color-coded categories, where Chinese and Japanese are rendered yellow.